Blog
30/11/2016
Surfing the Analytics Wave
The Salesforce Analytics Cloud, or Salesforce Wave Analytics, has been here for a while now and the buzz around it is going strong amongst our customers. Salesforce Analytics Cloud is seen as an interactive tool that provides more insights compared to the traditional Salesforce reports and dashboards. Salesforce Analytics sure does that, but it is more than just an add-on to traditional reporting.
Imagine the difference in grocery shopping between the past and now: in the old times, people used to go to a salesperson standing behind the counter and tell them what they wished to buy. If they got the wrong product or didn’t quite like the colour of the apples, after all, they had to hand the stuff back and ask for a replacement. This is exactly what is being done with the traditional reporting and BI tools – somebody from the business decides what they need, explains it to an administrator and waits for the appropriate report or dashboard to be created. Then he checks if it meets their needs, provides further specifications and waits again, and this can go on for days, weeks or even months. Later comes another person from a different department who wants to see the same data from a slightly different viewpoint. By the time everybody gets the data in the correct format for them, it might already be too late for what they actually wanted to achieve with it.
Self-service is natural for grocery shopping. I’m pretty sure I’m not the only one who wants to squeeze their avocados before choosing the perfect one and who gets inspired by walking through the aisles comparing different products and packages. Why should searching for perfect insights and visualisations from your data be any different to this? With Salesforce Analytics Cloud, everybody from your company can bring in their preferred set of data and start exploring it intuitively. Sure, it makes sense for an admin to create some datasets, lenses, and dashboards there to start with, but working with Salesforce Analytics Cloud is so easy and efficient that really anybody can do it on the fly.
Now that I’ve got your interest let’s jump into details. What can you actually do with Salesforce Analytics Cloud, and how? The easy way to start exploring the possibilities of Salesforce Analytics Cloud is by utilising the pre-built Apps by Salesforce – the Sales Wave App and the Service Wave App offer a set of datasets and dashboards optimised for sales and service use. You are able to configure the apps to some extent, but for more custom business needs, you’ll probably want to add your own datasets and visualisations on top of the variety of pre-built items.
 Wave Dashboard
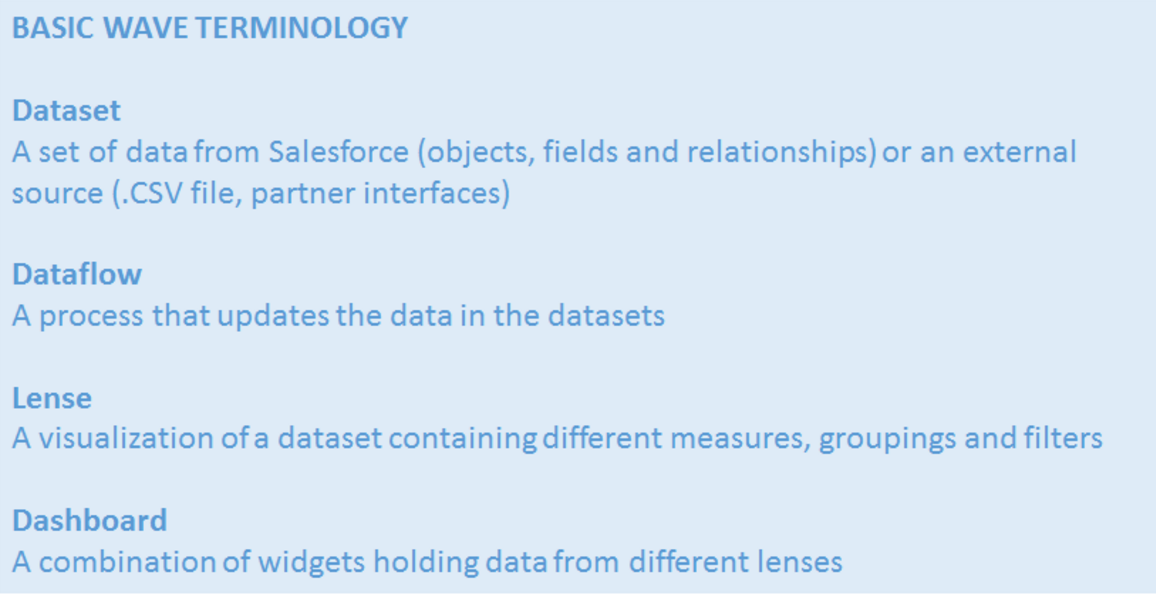
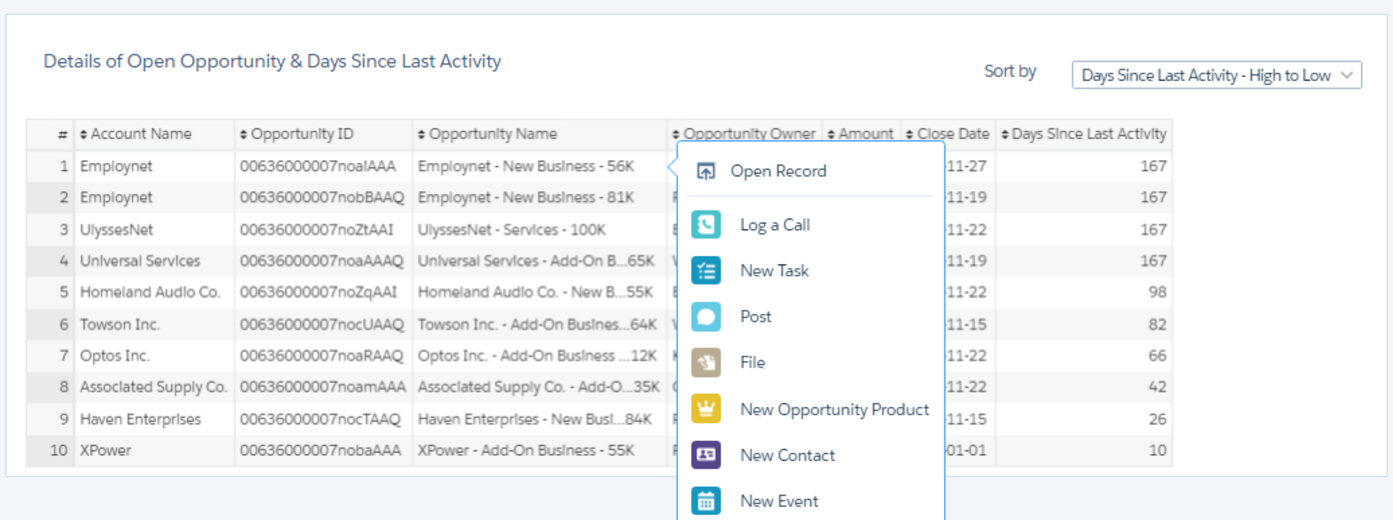
Once the data is in, you can start your exploration. You can dive into the data through a lens that lets you view the data from different viewpoints, experiment with different visualisations and drill down to interesting parts by filtering the data. You can operate with individual lenses and store the most intriguing findings, or you can combine a set of different lenses to a dashboard. A dashboard consists of several widgets that can contain, for example, graphs, numbers, text, tables or pictures. The widgets on a dashboard can be interlinked, meaning that you can apply common filters to change the whole view at once. This all makes Salesforce Analytics Cloud a highly intuitive, interactive and effective analytics tool. You can get meaningful insights in a flash, regardless of what your goal or role in the company is. But, unlike the more traditional BI tools with Salesforce Analytics Cloud, it doesn’t have to stop there. Since it is directly connected to your Salesforce instance, you can also take direct action based on the insights. The quick actions in your instance are easily accessible from within Salesforce Analytics Cloud. Imagine creating a task to notify a high amount of opportunity owner to take action or update account information based on your exploration without needing to navigate separately to the record in question. You can even add your customised quick actions to perform various tasks according to your specific needs. It is also possible to share any lens or dashboard to Chatter, either as a link or as a screenshot of the relevant visualisation. No more excessive navigation between the different tabs in your org or various emails containing manual screenshots and excel files – with a couple of clicks within Salesforce Analytics Cloud, you’ve shared meaningful insights to everybody who needs to know.
And it works vice versa as well. With embedded dashboards, you can bring Salesforce Analytics data and visualisations to your record page layouts. Viewing the key figures and graphs on the record itself saves your time and clicks, and you can easily dig deeper into the data through the embedded dashboard. I promised you earlier that Salesforce Analytics Cloud is accessible whenever, wherever. This is enabled by the Salesforce Analytics Analytics mobile app for iOS and Android. After downloading the app and logging in, your Salesforce Analytics data is available to you in a mobile-optimized way. No need for customisation or setting up; you’re ready to start exploring and taking action.
When starting with Salesforce Analytics, it is good to keep in mind that the tool is constantly evolving like all Salesforce Clouds. The tool is already impressive, but there are some improvement points for the future.
First of all, when things get complicated, you need to use code. Luckily it’s simple JSON that even a not-so-technically oriented admin such as myself can operate with to some extent, but you can’t really assume a business user to edit a .json file. Accessing the code is also not made easy as it’s hidden behind a keyboard shortcut that you just need to know. Let’s hope the rumours are true, and even more complicated editing of dashboards, such as combining data from different sources, will be possible through the user interface in the future.
The classic version of the Salesforce Analytics Cloud dashboard designer is also lacking some useful features, such as being able to align the widgets automatically and sending them back or bringing them to the front. Since this type of functionality is familiar with basic office tools, it can be really annoying not to have it. The new beta version of the designer brings some relief to that, enabling placing widgets only to predefined areas nicely aligned. However, this results in some limitations considering, e.g. the widget sizes and positions, so no perfect solution is available yet.
Even with the current restrictions, I personally am convinced about the possibilities of Salesforce Analytics and feel that it can bring high value to many businesses when properly planned, implemented and brought into use. Be it better real-time insights for your business people or less secretary work for your administrators, surfing the Salesforce Analytics Cloud wave is something everybody in your company can benefit from.
Business Consultant
Read next
20/12/2016
Working at Fluido
3 minute read