Blog
17/12/2015
Salesforce opportunity reporting – formulas for calculating sales performance
4 minute read
Fiddling with numbers and reports is every administrator’s favorite pastime. Reporting takes time to master - you need to know more about what the data in the fields tell you rather than the functionalities of the report builder.
The opportunity process in Salesforce contains functions that you don’t necessarily run across until you report on them. Here are a couple of easy formulas for reporting on sales performance – right out of the box.
Calculating the win rate
A number of opportunities won per number of opportunities closed. These numbers come from the opportunity process where you determine which stages are marked as “Open”, “Closed” or Closed Won”. Note – this means that “Closed” includes BOTH won and lost opportunities.
WON:SUM/CLOSED:SUM

The number of closed opportunities per total number of opportunities.
CLOSED:SUM / RowCount
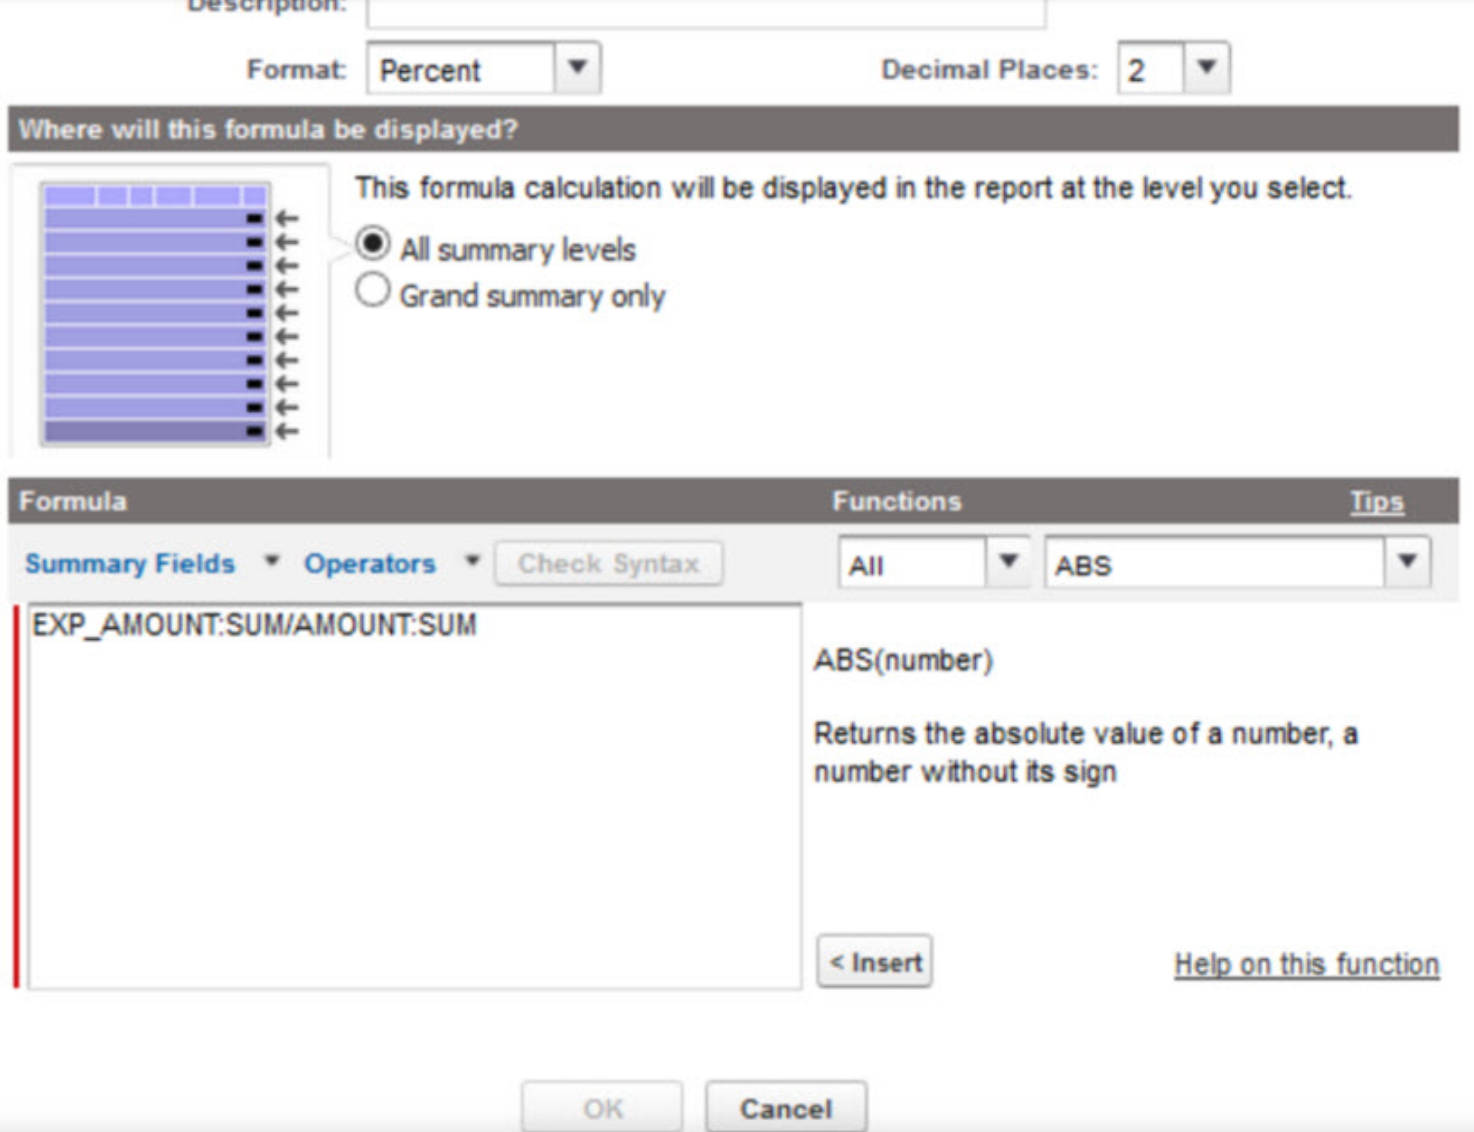
Value of opportunities won per value of opportunities closed
This one is a bit trickier because it requires knowledge of how the opportunity standard fields function. After that, it becomes relatively simple.
EXP_AMOUNT:SUM/AMOUNT:SUM
This compares all closed opportunities based on Expected Revenue to Amount. The Expected revenue field is a standard opportunity field that shows what the expected amount on the opportunity is.
1) If an opportunity is “Closed Lost”, the Expected Revenue is 0 Euros. (0% of the amount)
2) If the opportunity is “Closed Won”, the Expected Revenue = Amount (100% of the amount)
3) Amount of course always shows the value of the opportunity regardless of the opportunity status


Pauliina Löytty
Chief People Officer
Fluido
Read next
12/02/2016
The New Era of Customer Service
5 minute read