Blog
29/03/2021
Grow the ROI of your marketing activities by visualizing your full marketing funnel
5 minute read
Are you struggling with measuring the full effect of your marketing activities? The answer might be found in assessing your full marketing funnel.
Different approaches can be taken for visualising the full marketing funnel view. When the marketing data is all in one place, you can make a proper comparison between the different channels’ performance and grasp their contribution to the business.
But how to achieve that? In digital marketing, where you have a lot of different tools for running campaigns in different channels, getting data is not really the problem as the tools themselves offer a great amount of data and reporting capabilities. The challenge lies in bringing the data into one unified view.
The challenge with using an individual channel’s own analytics
Let’s take as an example a B2B company that’s running campaigns through three different channels: Google Ads (paid search), Facebook and LinkedIn. How would you measure the performance of your marketing campaigns if the data from these tools was the only data that was available?
Let’s say as an example that the action that all of these tools would be following as conversion would be a lead form submission on the website. Let’s then look at an example journey of a potential customer. To really make a point let’s say that they were exposed to the ads on all of these three different platforms during a period of 2 weeks:
Day 1: The person saw an ad on Facebook, clicked it and read through an article (just like this one).
Day 5: After seeing some ads on LinkedIn, the potential customer ended up again on the company website, browsing for more information.
Day 14: Something in the earlier visits was probably quite interesting. This time the person made a Google search and ended up on the company website for the third time through a paid search result. During the visit, they submitted a lead form to be contacted by sales later.
Which channel should get the credit for this conversion?
Attribution with the individual tools’ own analytics
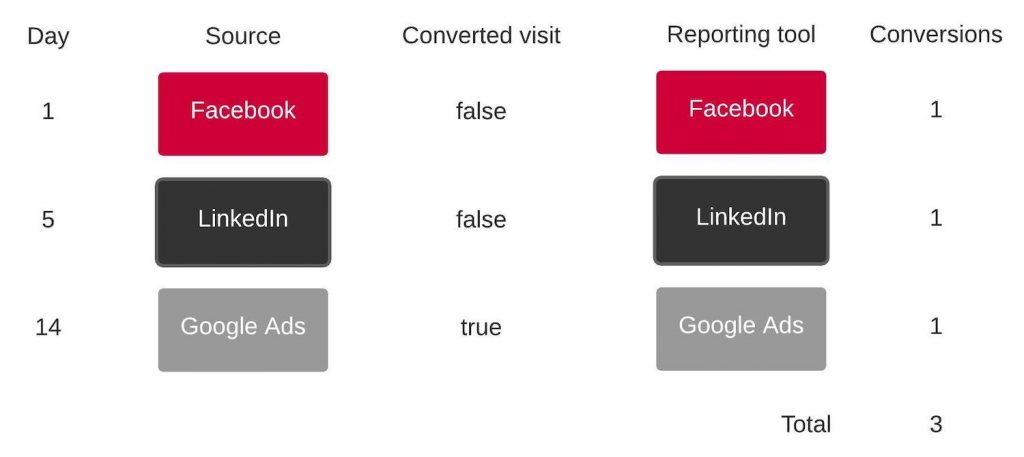
If you look at the tools’ own reporting, they are all happy to claim the credit. After all, they all had a part in this journey during their attribution windows. This is arguably a fine method to measure the performance for optimisation purposes, but it’s not attribution. The credit for the conversion is only attributed to the tool’s own campaigns.
In this artificial example, when the numbers were summed up, the conversion was reported three times because all of the tools took credit for the same conversion.
Tracking conversions with Google Analytics
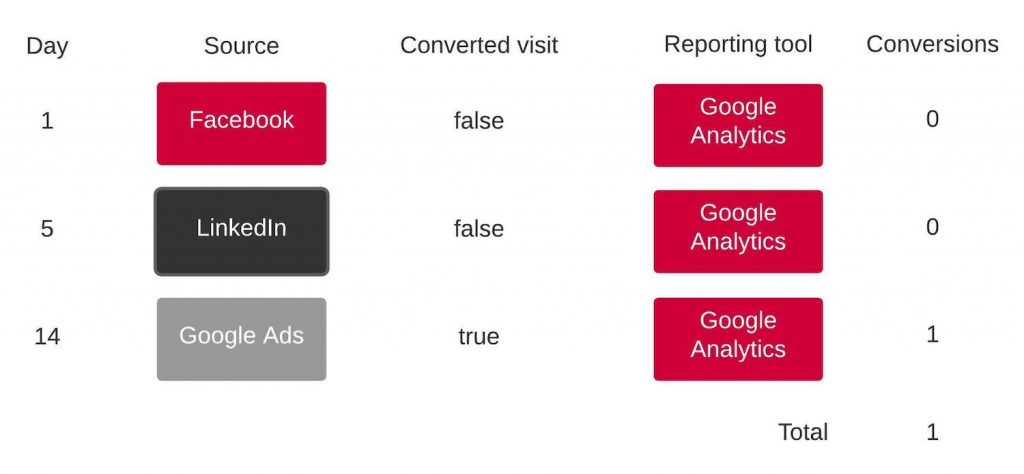
When you want to track which channel should be credited for the conversion, that is where tools like Google Analytics come in. Google Analytics measures the source of traffic of the visits that enter the website. When a conversion on the website happens, typically, the last source of traffic is credited. In this example case, the credit would go to Google Ads as it was the last touchpoint.
This is again not perfect at all, but much better already. Last click attribution, of course, favours those channels that are typically present during the last steps of the journey, like Google Search. Some channels might have an important role in creating demand. Google Search results could be seen as capturing this demand. This can be adjusted with different types of attribution models. The most important thing is that the channels are now in one place, and it’s possible to actually attribute the conversion between the different channels.
Attribution with Google Analytics
When Google Analytics was used for reporting instead, only the last visit got the credit.
In B2B business, submission of a lead form can hardly be seen as an actual conversion, but this is where Google Analytics’ tracking capabilities end. After the point of the form submission the journey still continues but is handled in a CRM system such as Salesforce.
In the CRM, there are still some steps to go: At first, the form submission might create a lead. After the potential of this lead has been verified, it might turn into an opportunity. This opportunity might then turn into an actual deal later.
So how would you capture this full marketing funnel, from the first touch points to the actual conversion? In this example, we now have three different types of data:
- Advertising data consists of metrics like impressions, clicks and cost
- Web analytics data: traffic sources, events
- CRM data: leads, opportunities
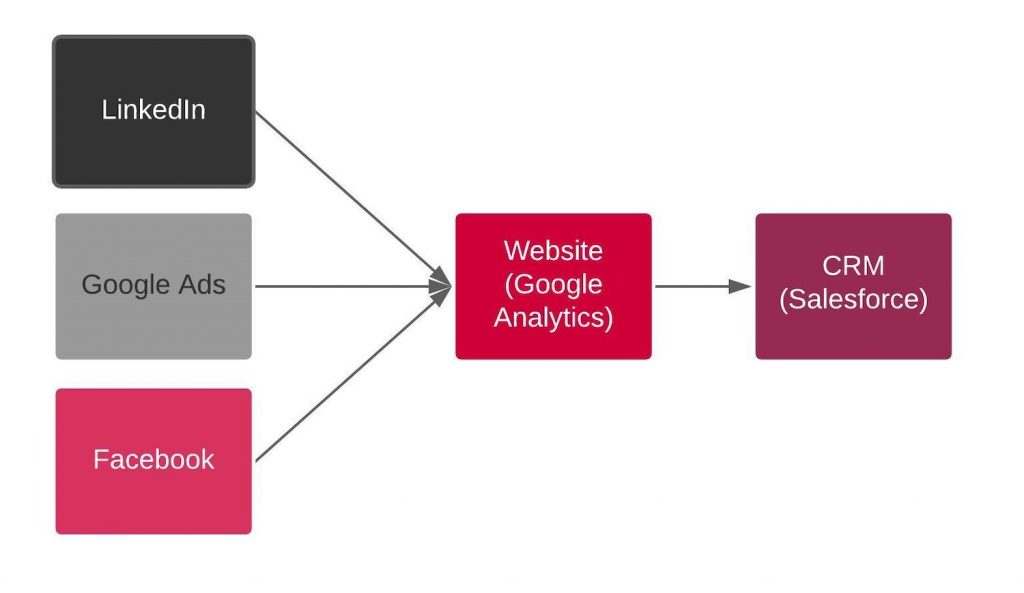
None of the systems covers the full funnel. To be able to visualise it, we need to identify the links between these three different types of data sources.
Enabling the full marketing funnel view
To form the full funnel view, the first link to be established is from the advertising data to the web analytics data. This usually happens through UTM tags that are added to campaign links to identify the source of traffic in Google Analytics. A lot can already go wrong at this point if there is no proper taxonomy for the UTM tagging. It’s very important to be systematic in tagging the traffic.
After the form submission, the information is passed from the website to the CRM. This is the second link that needs to be covered. Usually, this happens by passing some additional information in the hidden fields of the form. This information could be the same traffic source information that was collected by Google Analytics earlier from the UTM tags. It could even be the Google Analytics cookie id of the individual visitor, which would set up a visitor-level link.
Full marketing funnel view
There are different approaches to setting analytics like this up and collecting all the data in one place. One is the tool-based approach. Tools like Datorama or Funnel are designed to connect to the different systems to bring all the data under a common data model suitable for visualisation.
Another way to go is to set up a marketing data warehouse, which is a bit more technical but also offers the most freedom in designing a solution that best fits the situation. Google BigQuery is a popular option because of its tight connection to Google Analytics, especially the new Google Analytics 4. Even though BigQuery as a product is designed for handling massive volumes of data, its pay-per-use pricing model and free tier make it a very cheap option for proof of concept type projects or just for getting started with something small and building on top of that gradually.
When the data is all in one place and the links and tracking have been figured out, it’s possible to visualise the full funnel. You can see simple but useful things like how your advertising spend are split between the different channels and platforms. You can compare the different channels on their ability to create impressions and to turn those impressions into website visits. You could even follow your investment on a specific platform or campaign to the website visits and all the way to actual leads and opportunities.

Taneli Salonen
Senior Web Analytics Consultant
Read next
01/04/2021
Fluido achieves Salesforce Expert Navigator distinction for delivering expertise in Experience Cloud
1 minute read